
New site allows users to compare year-over-year changes
Trying to put numbers to just how different B.C.’s tourism industry is doing compared to last year? There’s now a dashboard for that.
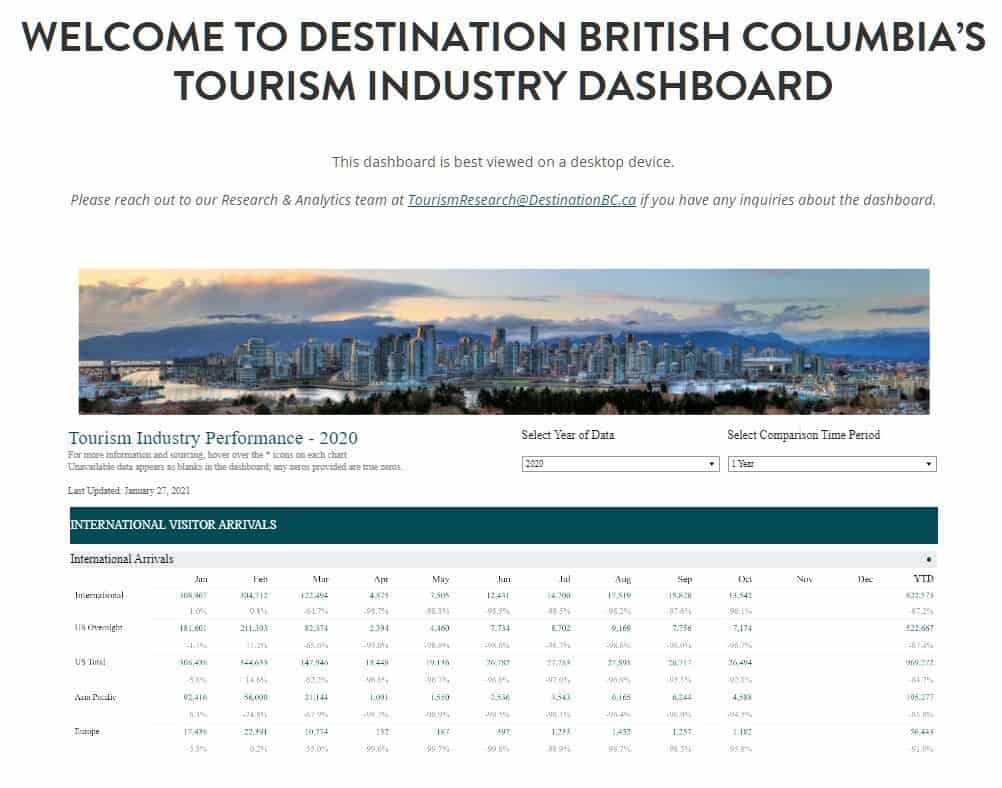
Destination BC, the province’s in-house marketing arm, has released what they are calling an “Industry Performance Dashboard.” It offers info on key tourism indicators and allows users to compare year-over-year figures.
Information on the following indicators are available on the site: international arrivals, restaurant receipts, convention centre data, hotel occupancy and average daily room rates, international and regional airport passenger volume, BC Ferries passenger volume, and highway traffic volume.
More are expected to be included as the dashboard evolves.
Most of the indicators feature updated info up until November 2020.

One thing that’s obvious is the devastating impact that COVID-19 has had on the province’s tourism industry at large.
You can check the dashboard out for yourself here.
What did you think of this story?
Sun Peaks Independent News is your essential source for community news in Sun Peaks. Your feedback after we publish a story helps ensure we're always improving our reporting to better serve you.